If you want to know more details about MGSA, please read this article: "MGSA: a Multi-ethnic Germline-Somatic Association database to decipher multilayered and interconnected genetic mutations in cancer."
MGSA is developed by Wang-Lab@HKUST.
Note 1: please wait a moment until the website loads completely.
Note 2: please do not run other functions when your module is in process.
Note: please do not select one row in the following table when searching.
Note: All results will be summarized when this box is null
Download results
Note: please select one pair and wait a moment.
Download PlotGWAS annotation
QTL annotation
Note: please do not select one row in the following table when searching.
OR
Download results
Note: please select one pair and wait a moment.
Download PlotGWAS annotation
QTL annotation
Note: please do not select one row in the following table when searching.
OR
Download results
Note: please select one pair and wait a moment.
Download PlotGWAS annotation
QTL annotation
Note: please do not select one row in the following table when searching.
AND
Download results
Note: please select one pair and wait a moment.
Download PlotGWAS annotation
QTL annotation
MGSA aims to systematically evaluate the effects of Germline genetic variants on Somatic alterations underlying pan-cancer level among three populations.
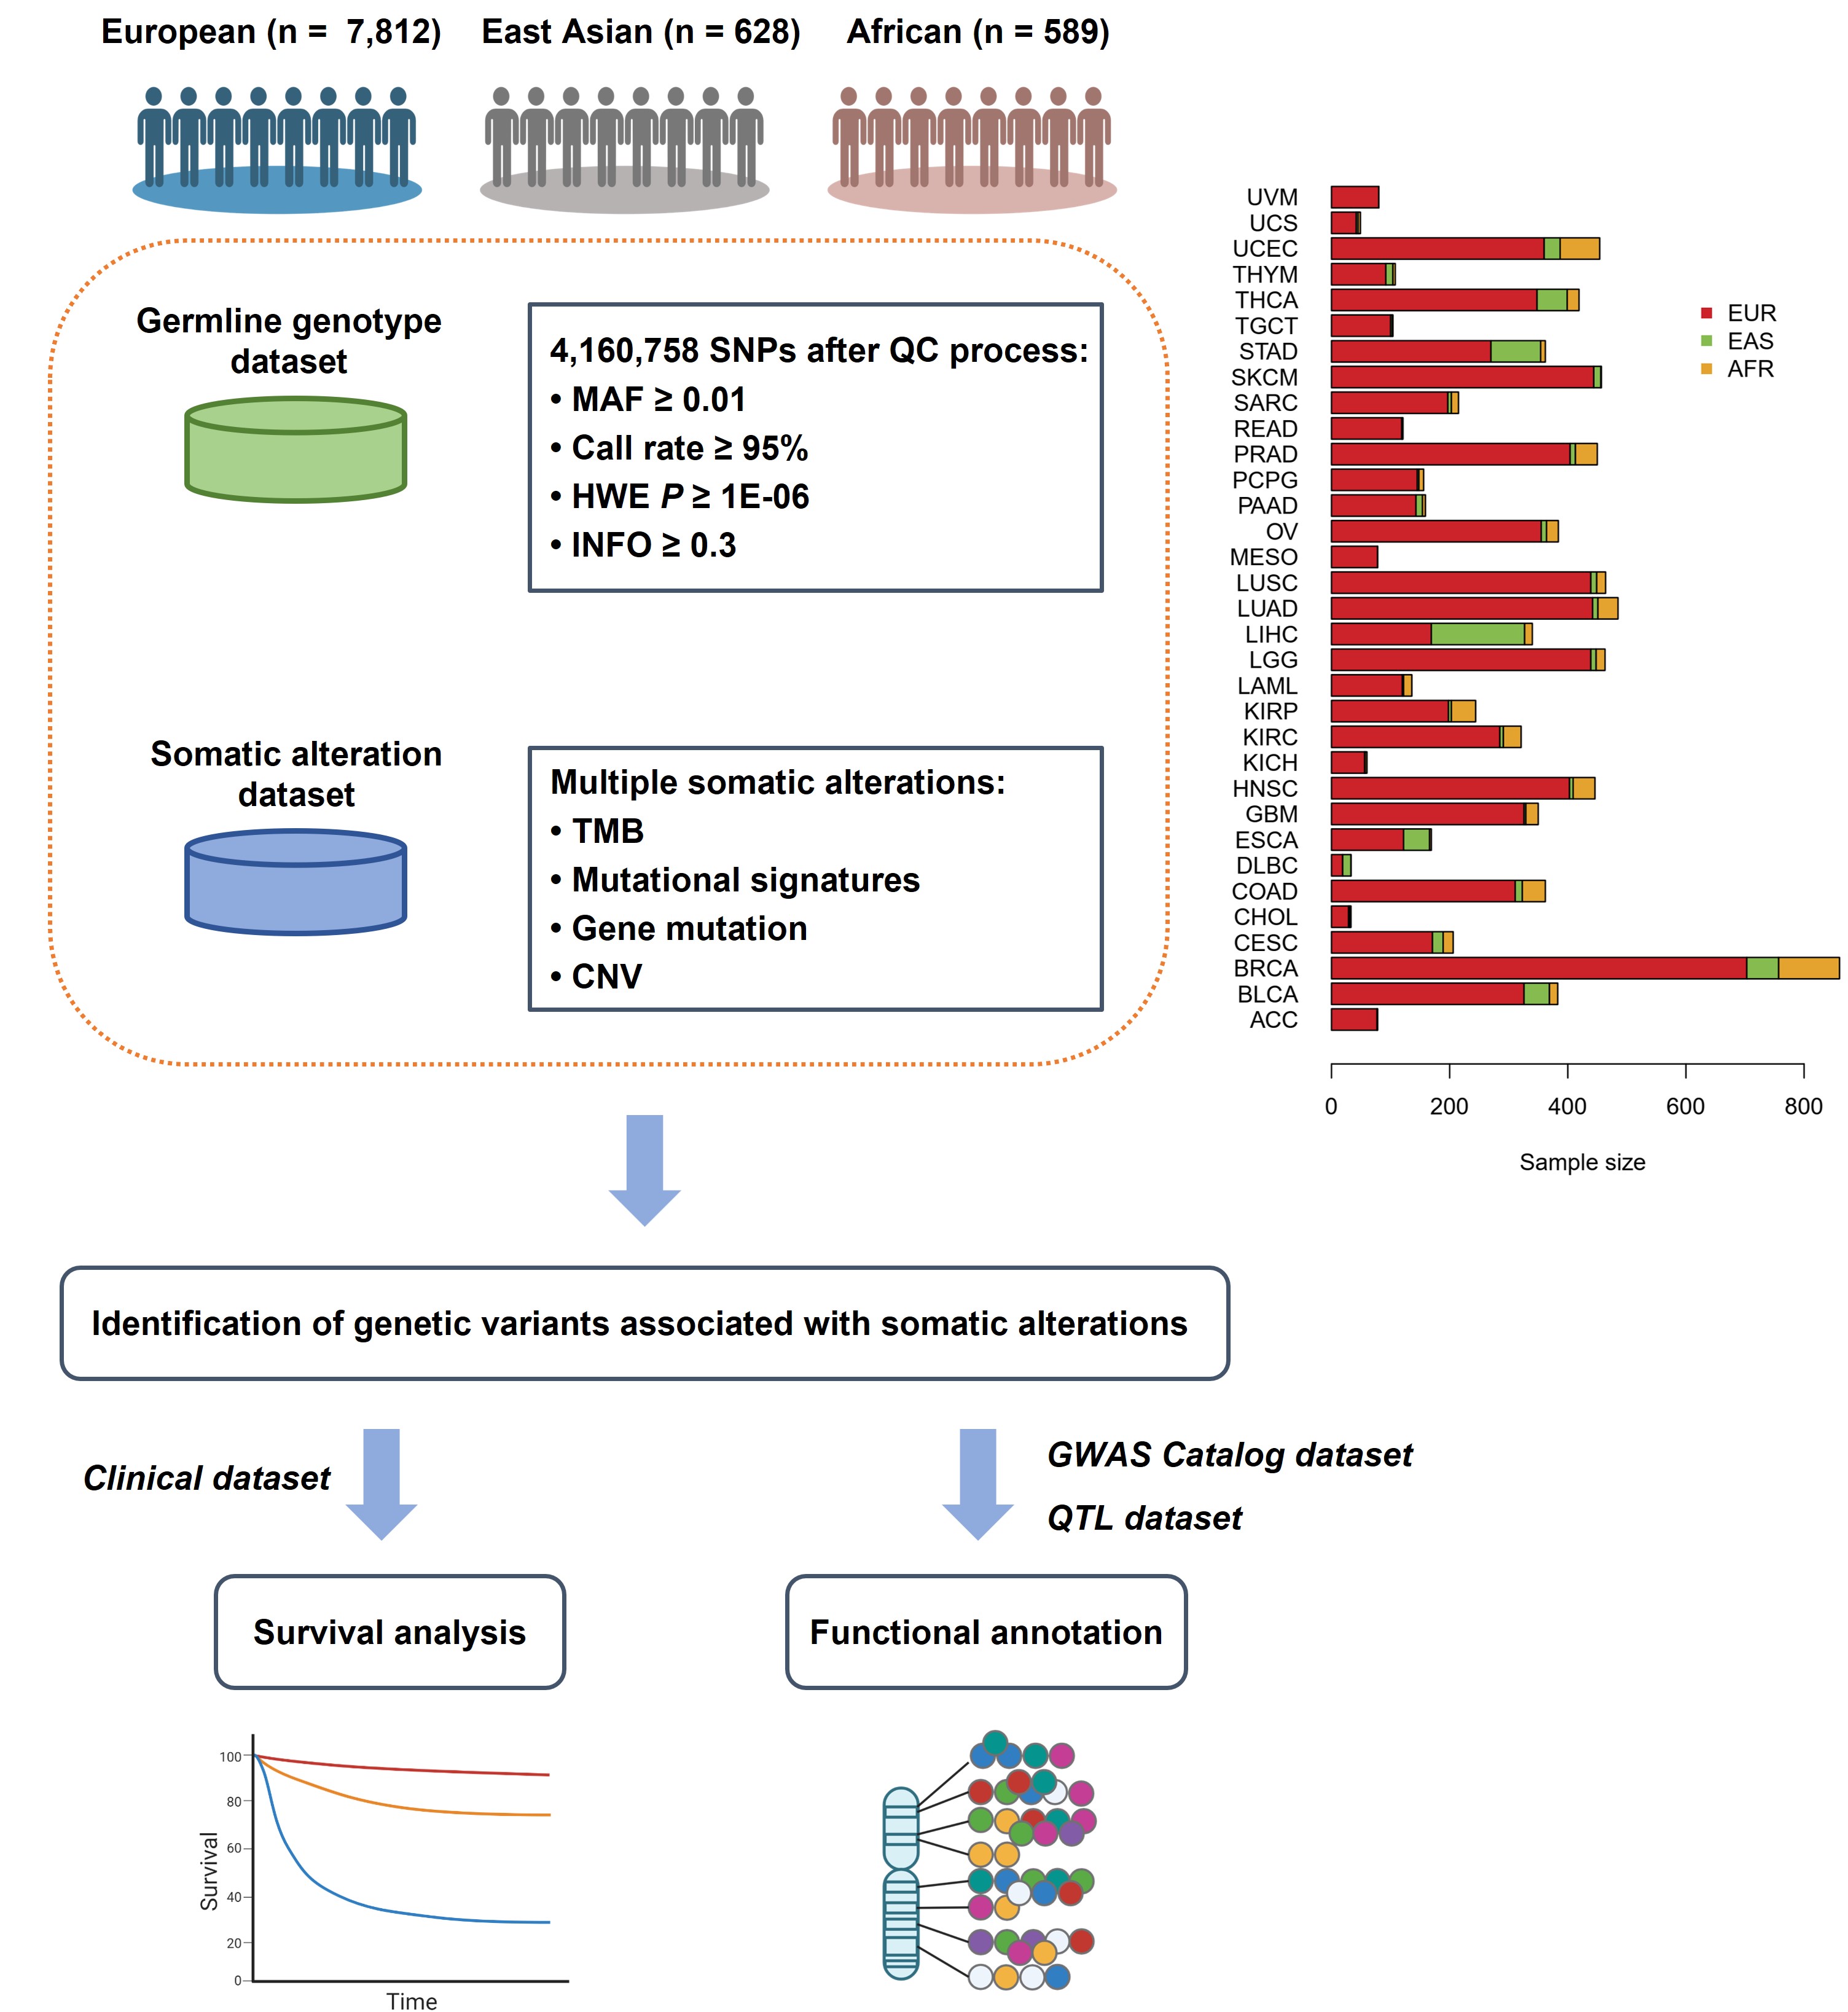
In MGSA, users can search and browse genome-wide association results (with P value lower than 0.001) of four somatic outcomes, including:
Note: We suggested to use the P-value threshold of 5E-06 to indicate a genome-wide statistical significance. In addition, the results with sample size less than 100 should be interpreted with caution.
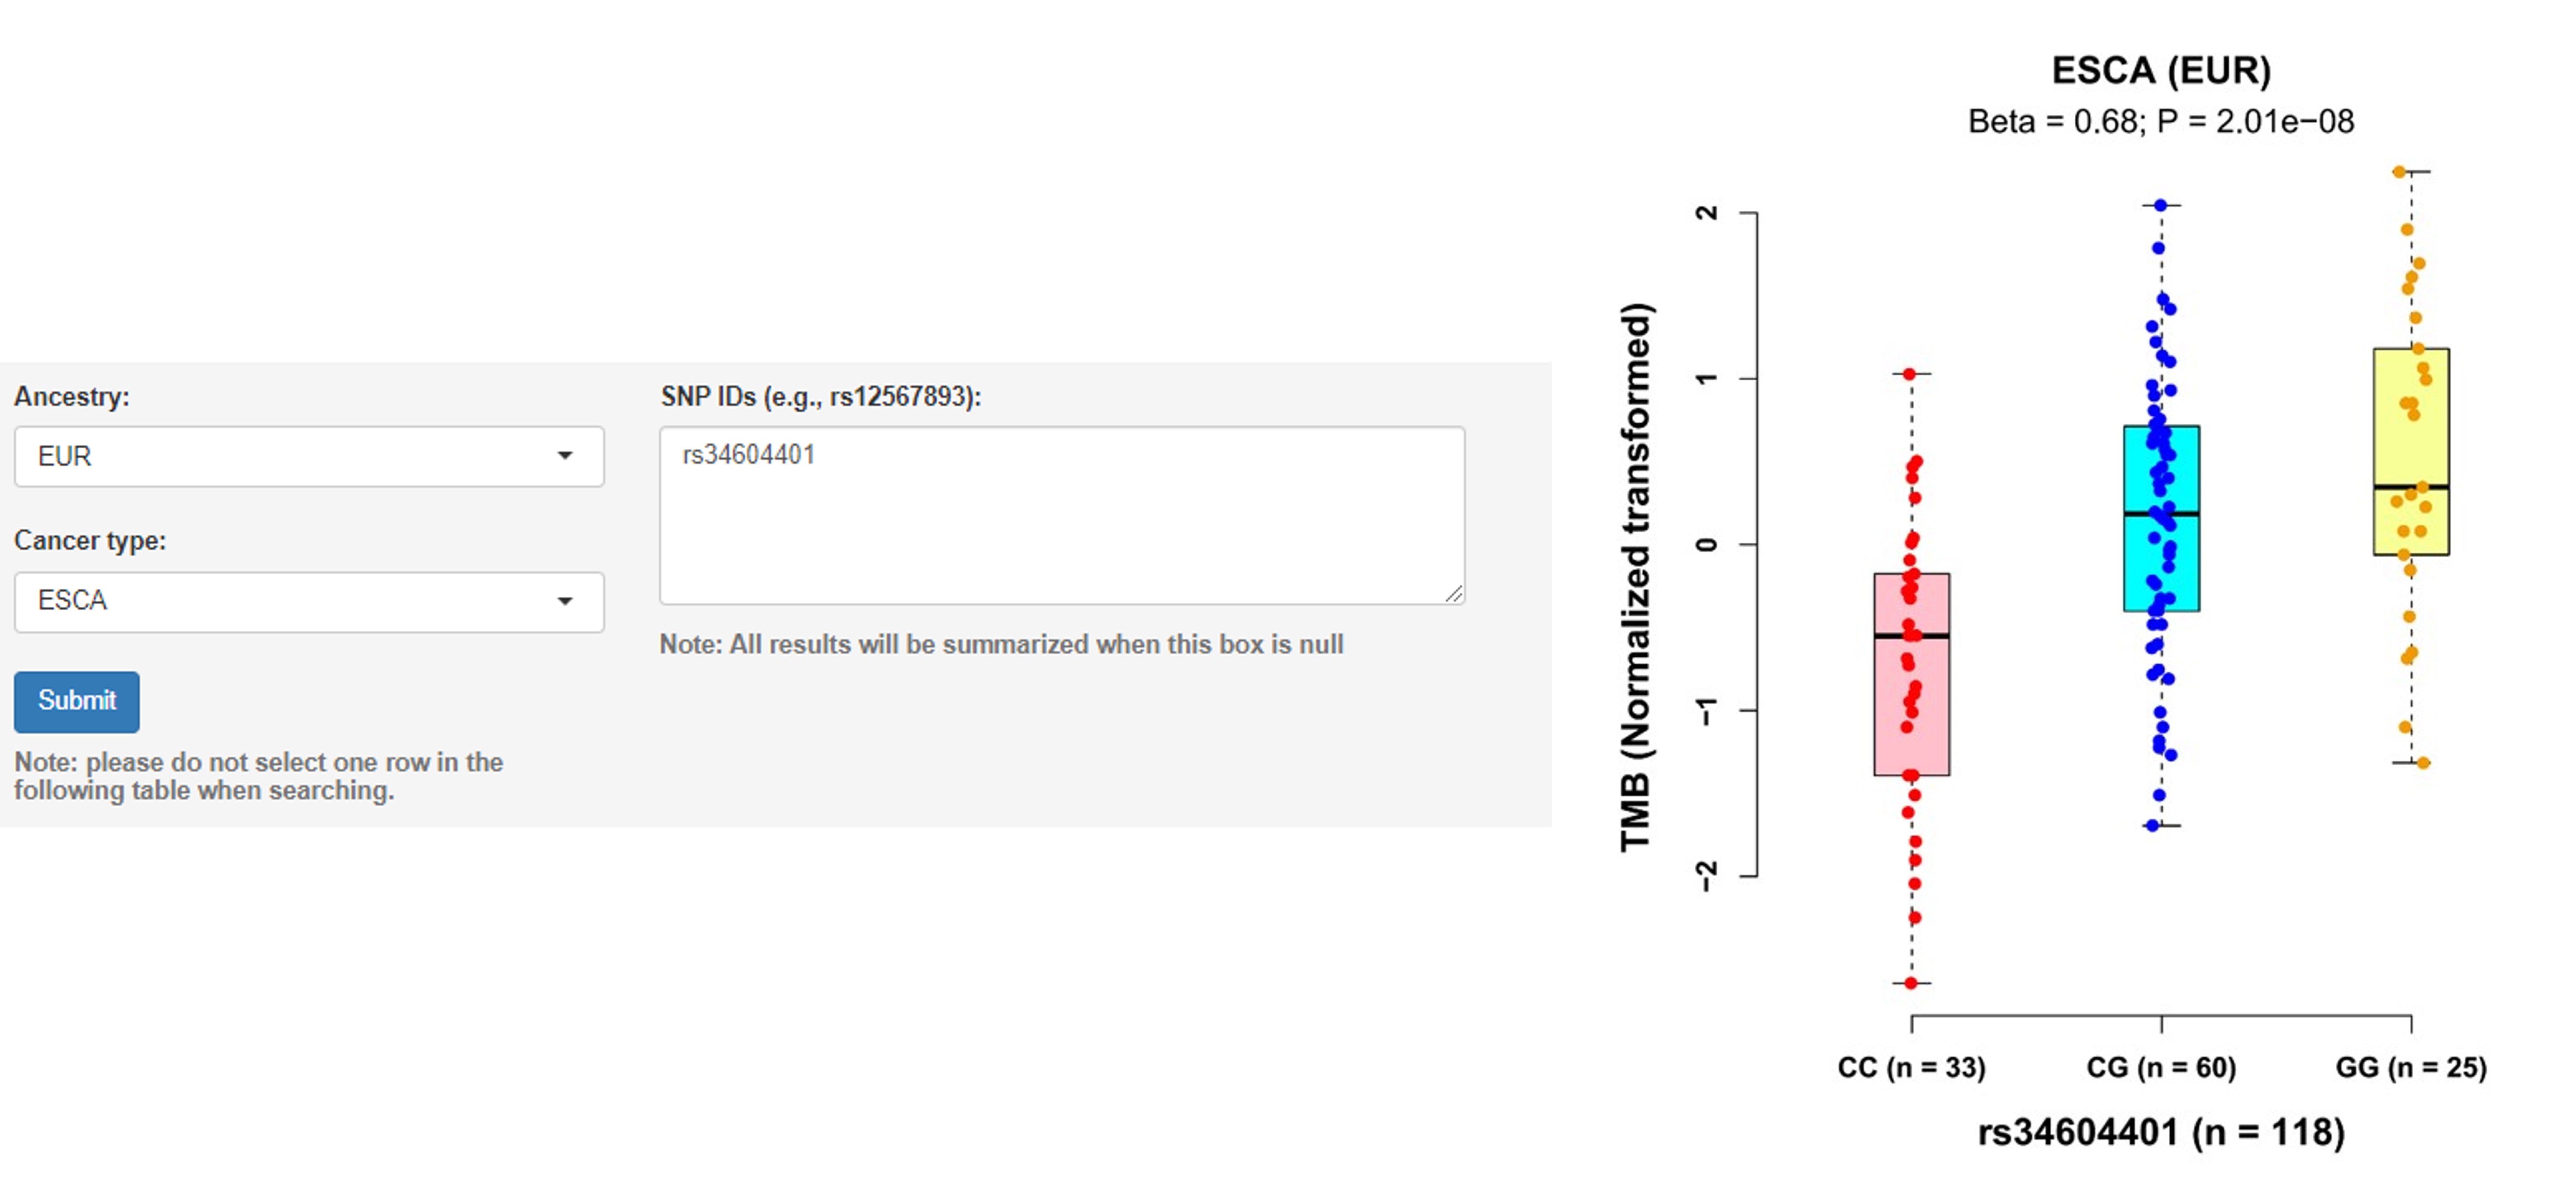
a. Associations of germline variants with TMB
Note: Tumor mutational burden (TMB) was defined as per Mb of nonsynonymous mutations that included single-nucleotide variants and small insertions/deletions (indels).
User guidelines: When users select an ancestry group and a cancer type, and enter a batch of SNP IDs, a table with the cancer type, somatic type, chromosome ID, SNP ID, SNP genomic position (hg19), SNP alleles (A1: minor/effect allele; A2: major/reference allele), MAF, Beta value (effect size of the SNP on TMB, derived from linear regression model), standard error (SE), P-value and adjusted P-value (e.g., Benjamini-Hochberg and Bonferroni methods) is displayed on this page. In addition, users can select one pair and click the 'Plot & clinical and functional annotation' button, a vector diagram of the boxplot and annotation results are provided.
Example: Individuals carrying the rs34604401 genotypes CG and GG had higher TMB than those carrying the genotype CC in ESCA samples of EUR ancestry (Beta = 0.68, P = 2.01E-08).
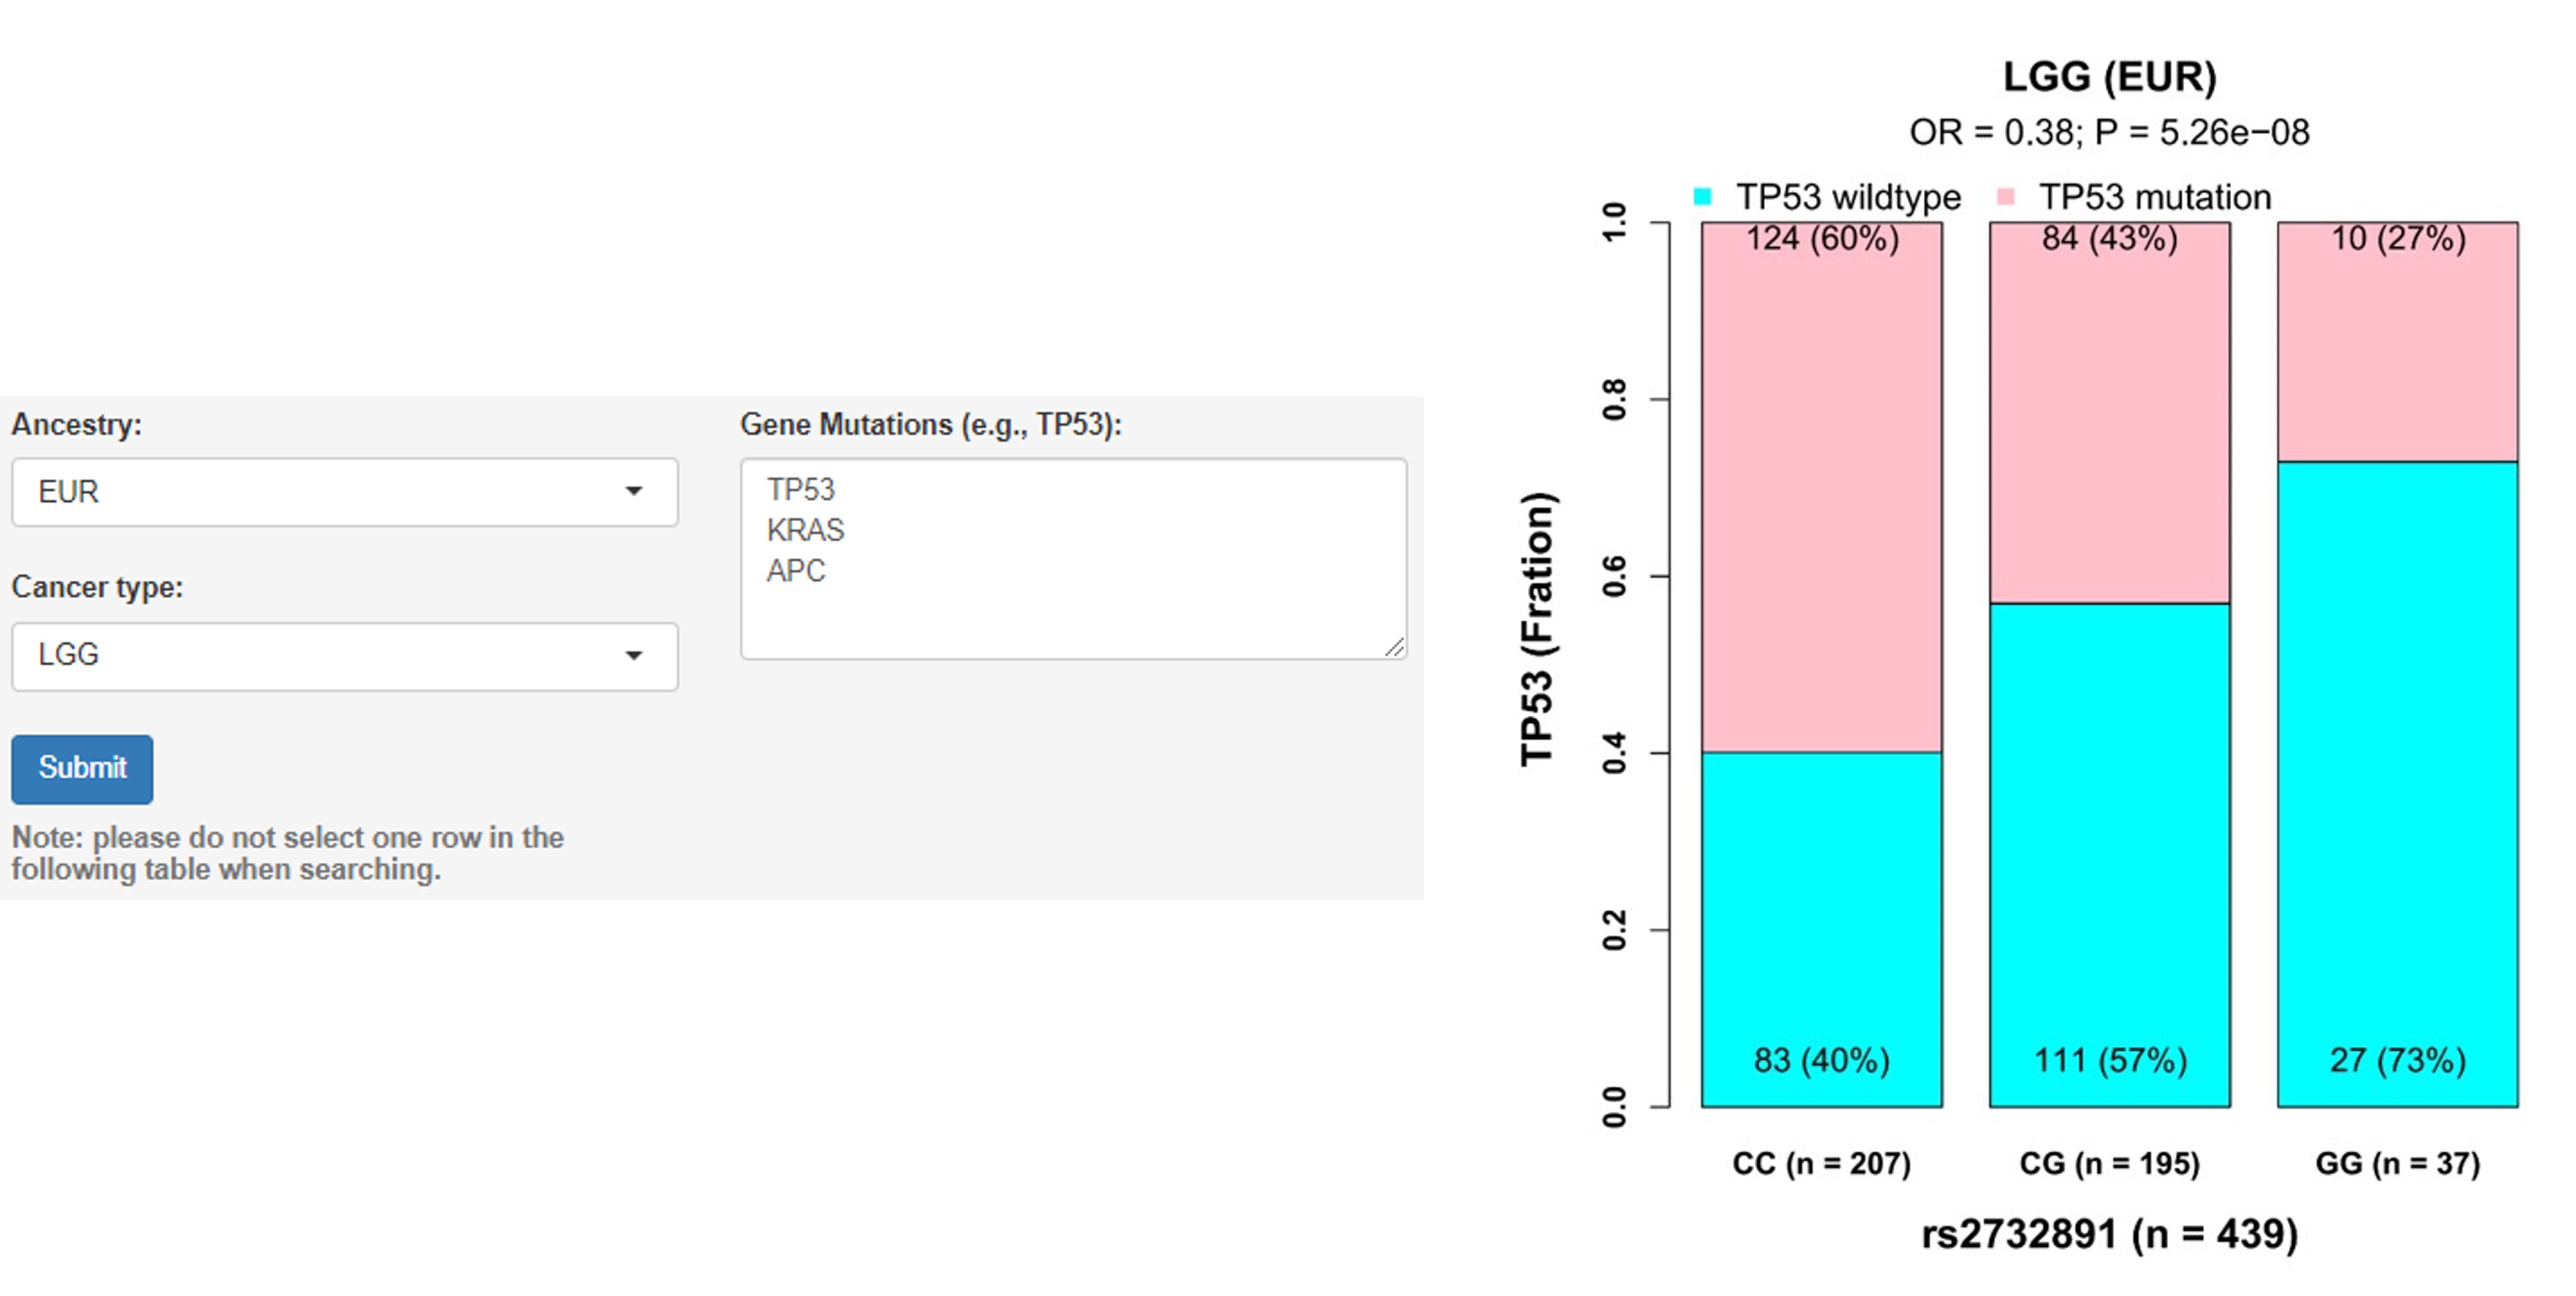
b. Associations of germline variants with gene mutation
Note: A gene with nonsynonymous mutations was considered as mutant.
User guidelines: When users select an ancestry group and a cancer type, and enter a batch of gene names, a table with the cancer type, somatic type (e.g., TP53 mutation), chromosome ID, SNP ID, SNP genomic position (hg19), SNP alleles (A1: minor/effect allele; A2: major/reference allele), MAF in mutated and wildtype samples, odds ratio (OR, derived from logistic regression model), SE, P-value and adjusted P-value (e.g., Benjamini-Hochberg and Bonferroni methods) is displayed on this page. In addition, users can select one pair and click the 'Plot & clinical and functional annotation' button, a vector diagram of the boxplot and annotation results are provided.
Example: Individuals carrying the rs2732891 genotypes CG and GG had lower TP53 mutation rates than those carrying the genotype CC in LGG (Low Grade Glioma) patients of EUR ancestry (OR = 0.38, P = 5.26E-08).
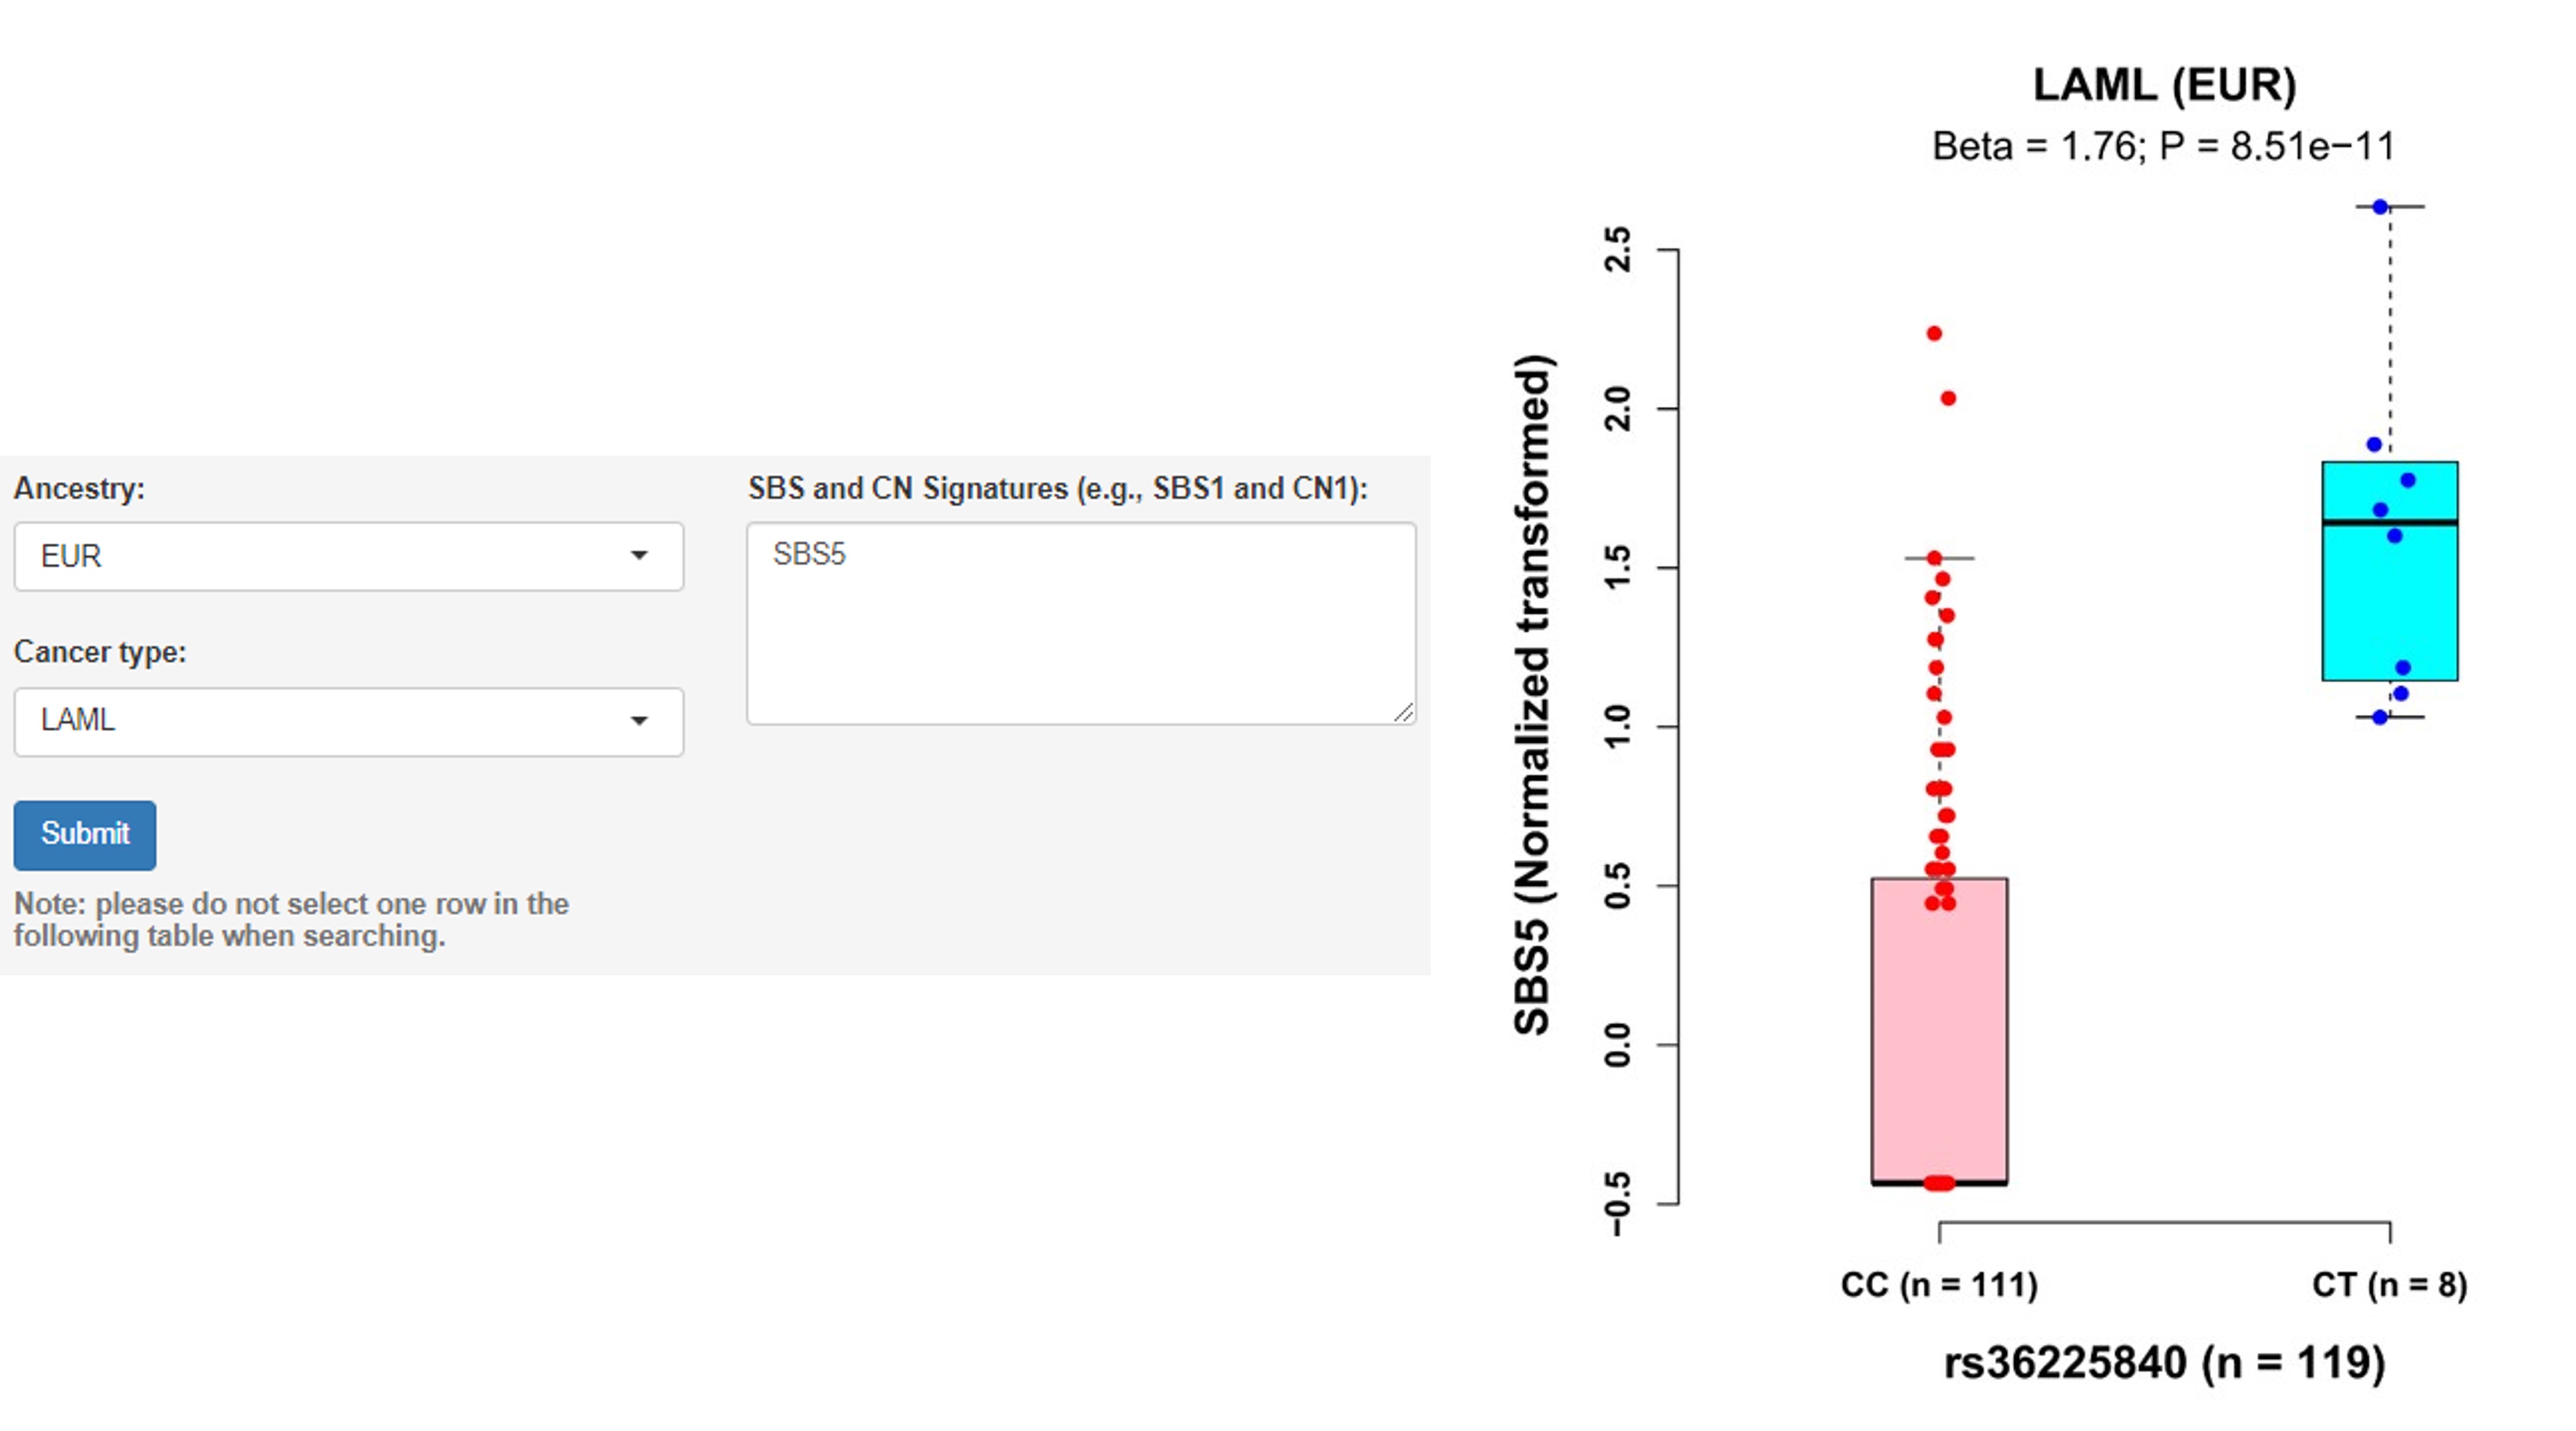
c. Associations of germline variants with signature
Note: Mutational signatures, inferred from WES data based on nonnegative matrix factorization method, reflect the activity of the mutational processes that have been active throughout a person's life. The detailed explanations about SBS and CN can be found in https://cancer.sanger.ac.uk/signatures/.
User guidelines: When users select an ancestry group and a cancer type, and enter a batch of SBS signatures, a table with the cancer type, somatic type (e.g., SBS1), chromosome ID, SNP ID, SNP genomic position (hg19), SNP alleles (A1: minor/effect allele; A2: major/reference allele), MAF, Beta value (effect size of the SNP on SBS, derived from linear regression model), standard error (SE), P-value and adjusted P-value (e.g., Benjamini-Hochberg and Bonferroni methods) is displayed on this page. In addition, users can select one pair and click the 'Plot & clinical and functional annotation' button, a vector diagram of the boxplot and annotation results are provided.
Example: rs36225840 T allele was found to be associated with an increased level of signature SBS5 among LAML (Acute Myeloid Leukemia) patients of EUR ancestry (Beta = 1.76, P = 8.51E-11).
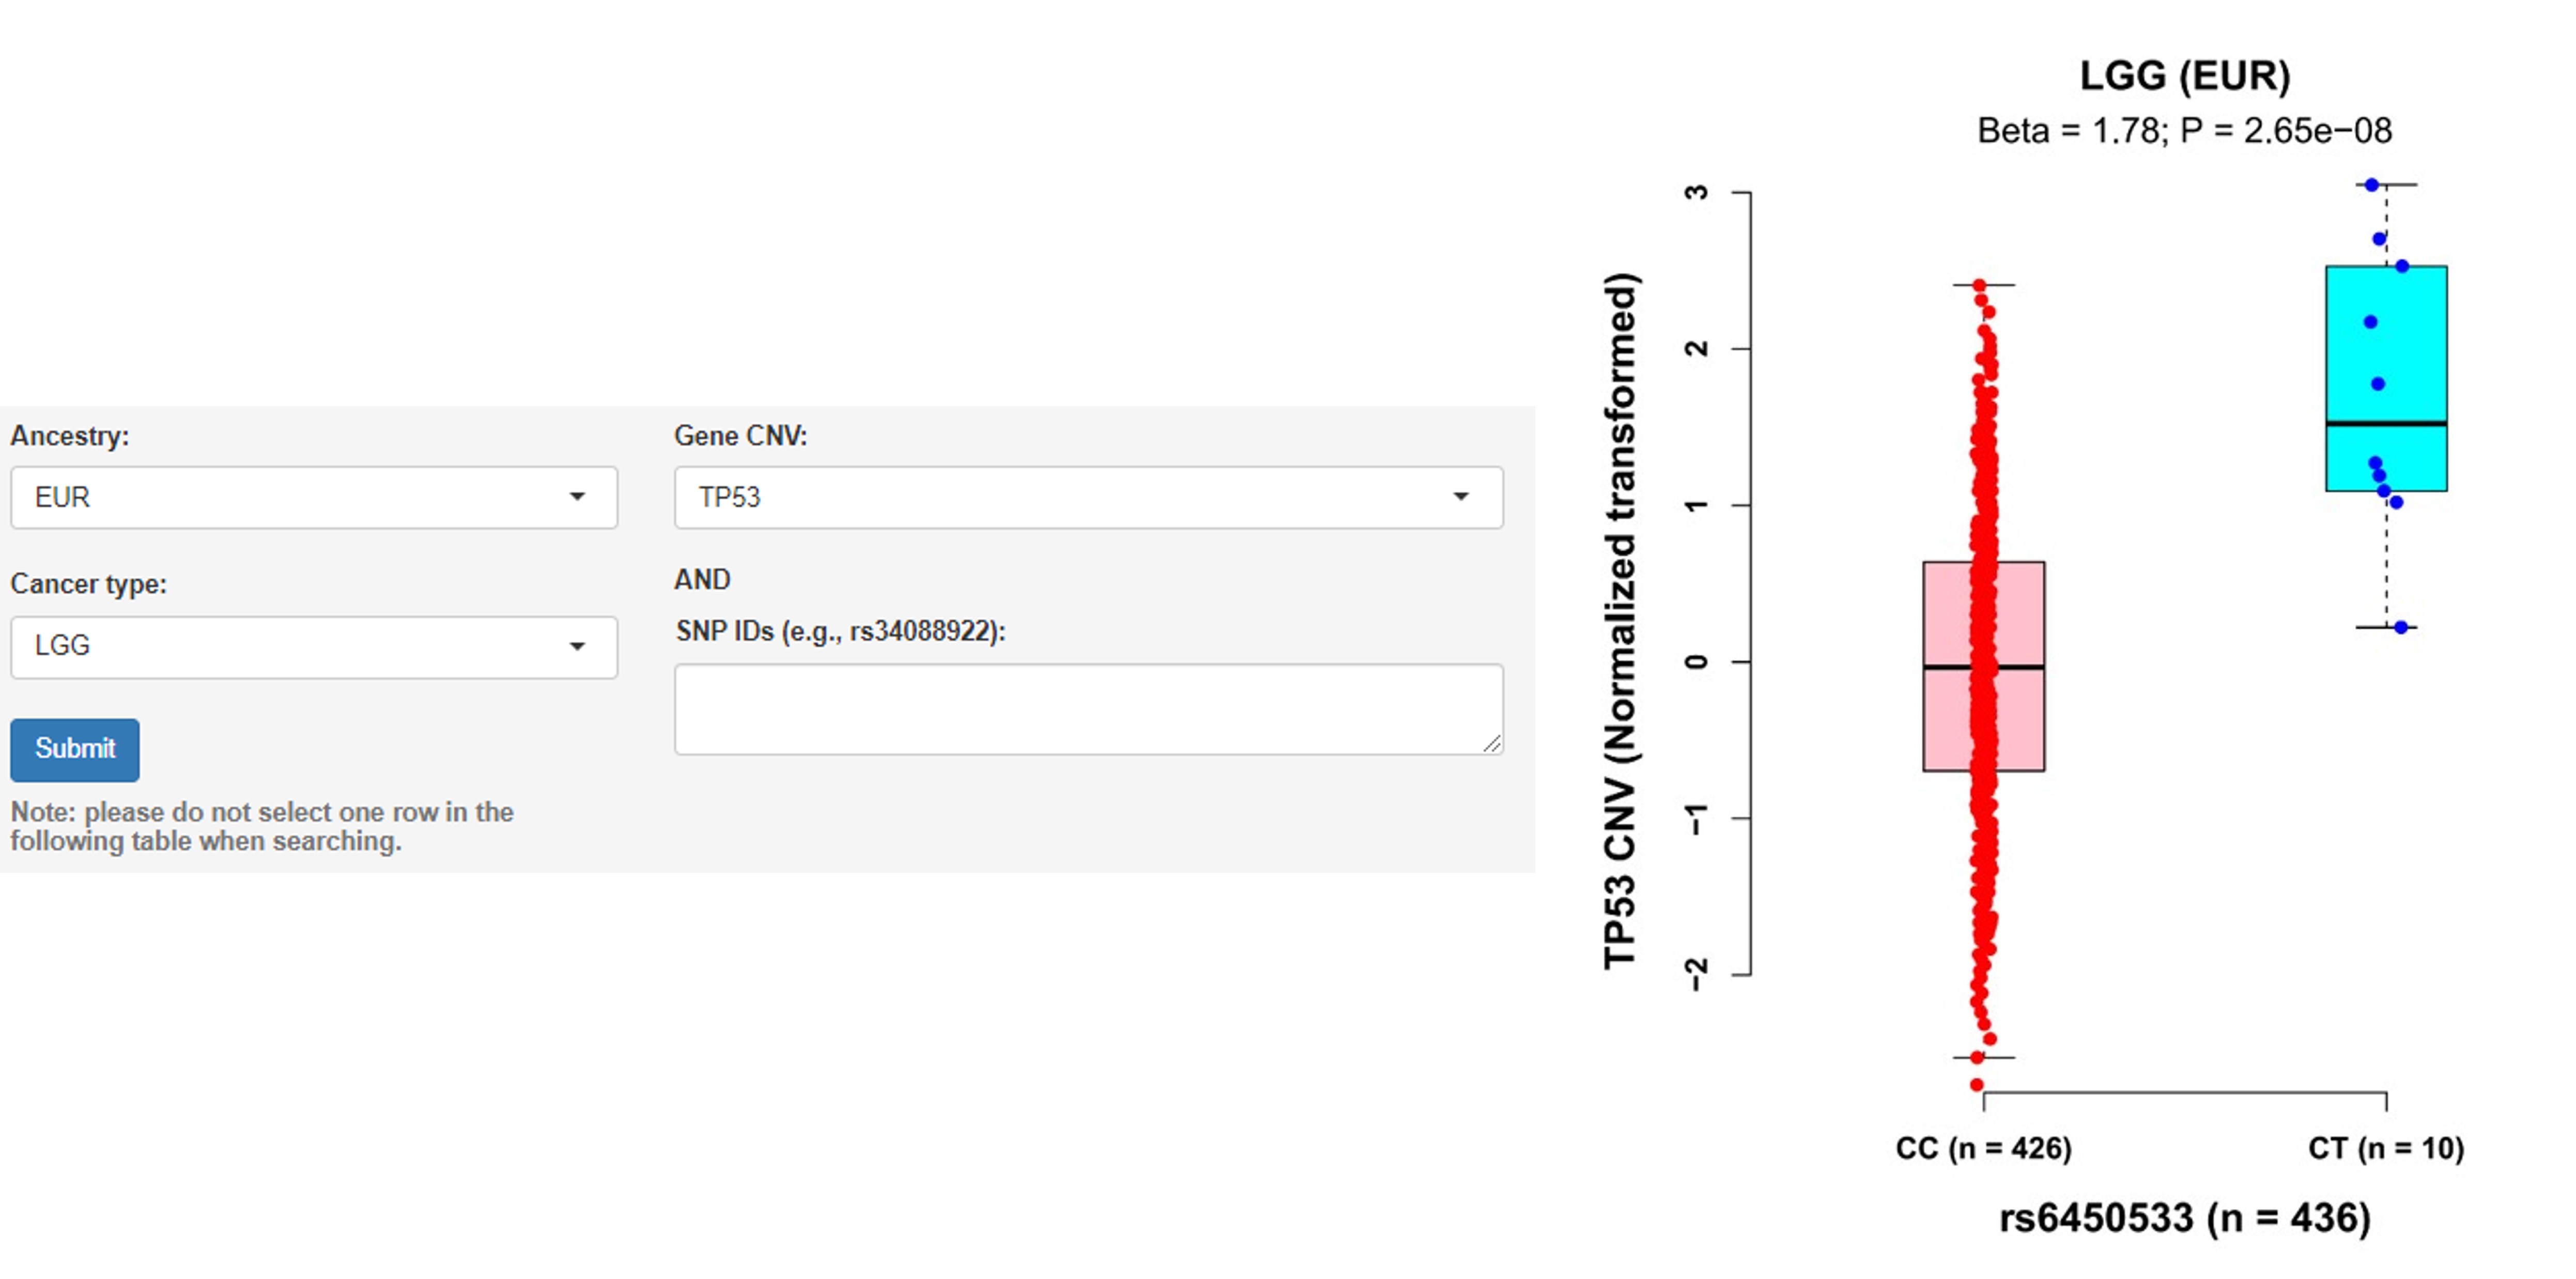
d. Associations of germline variants with CNV
Note: Copy number variations (CNVs), as a pervasive trait during tumorigenesis, are somatic changes to chromosome structure that result in gain or loss in copies of sections of DNA.
User guidelines: When users select an ancestry group, a cancer type and one gene name, and/or enter a batch of SNP IDs, a table with the cancer type, somatic type (e.g., TP53 CNV), chromosome ID, SNP ID, SNP genomic position (hg19), SNP alleles (A1: minor/effect allele; A2: major/reference allele), MAF, Beta value (effect size of the SNP on CNV, derived from linear regression model), statistics, P-value and adjusted P-value (e.g., Benjamini-Hochberg and Bonferroni methods) is displayed on this page. In addition, users can select one pair and click the 'Plot & clinical and functional annotation' button, a vector diagram of the boxplot and annotation results are provided.
Example: Individuals carrying the rs6450533 genotype CT had higher TP53 CNV value than those carrying the genotype CC in LGG samples of EUR ancestry (Beta = 1.78, P = 2.65E-08).
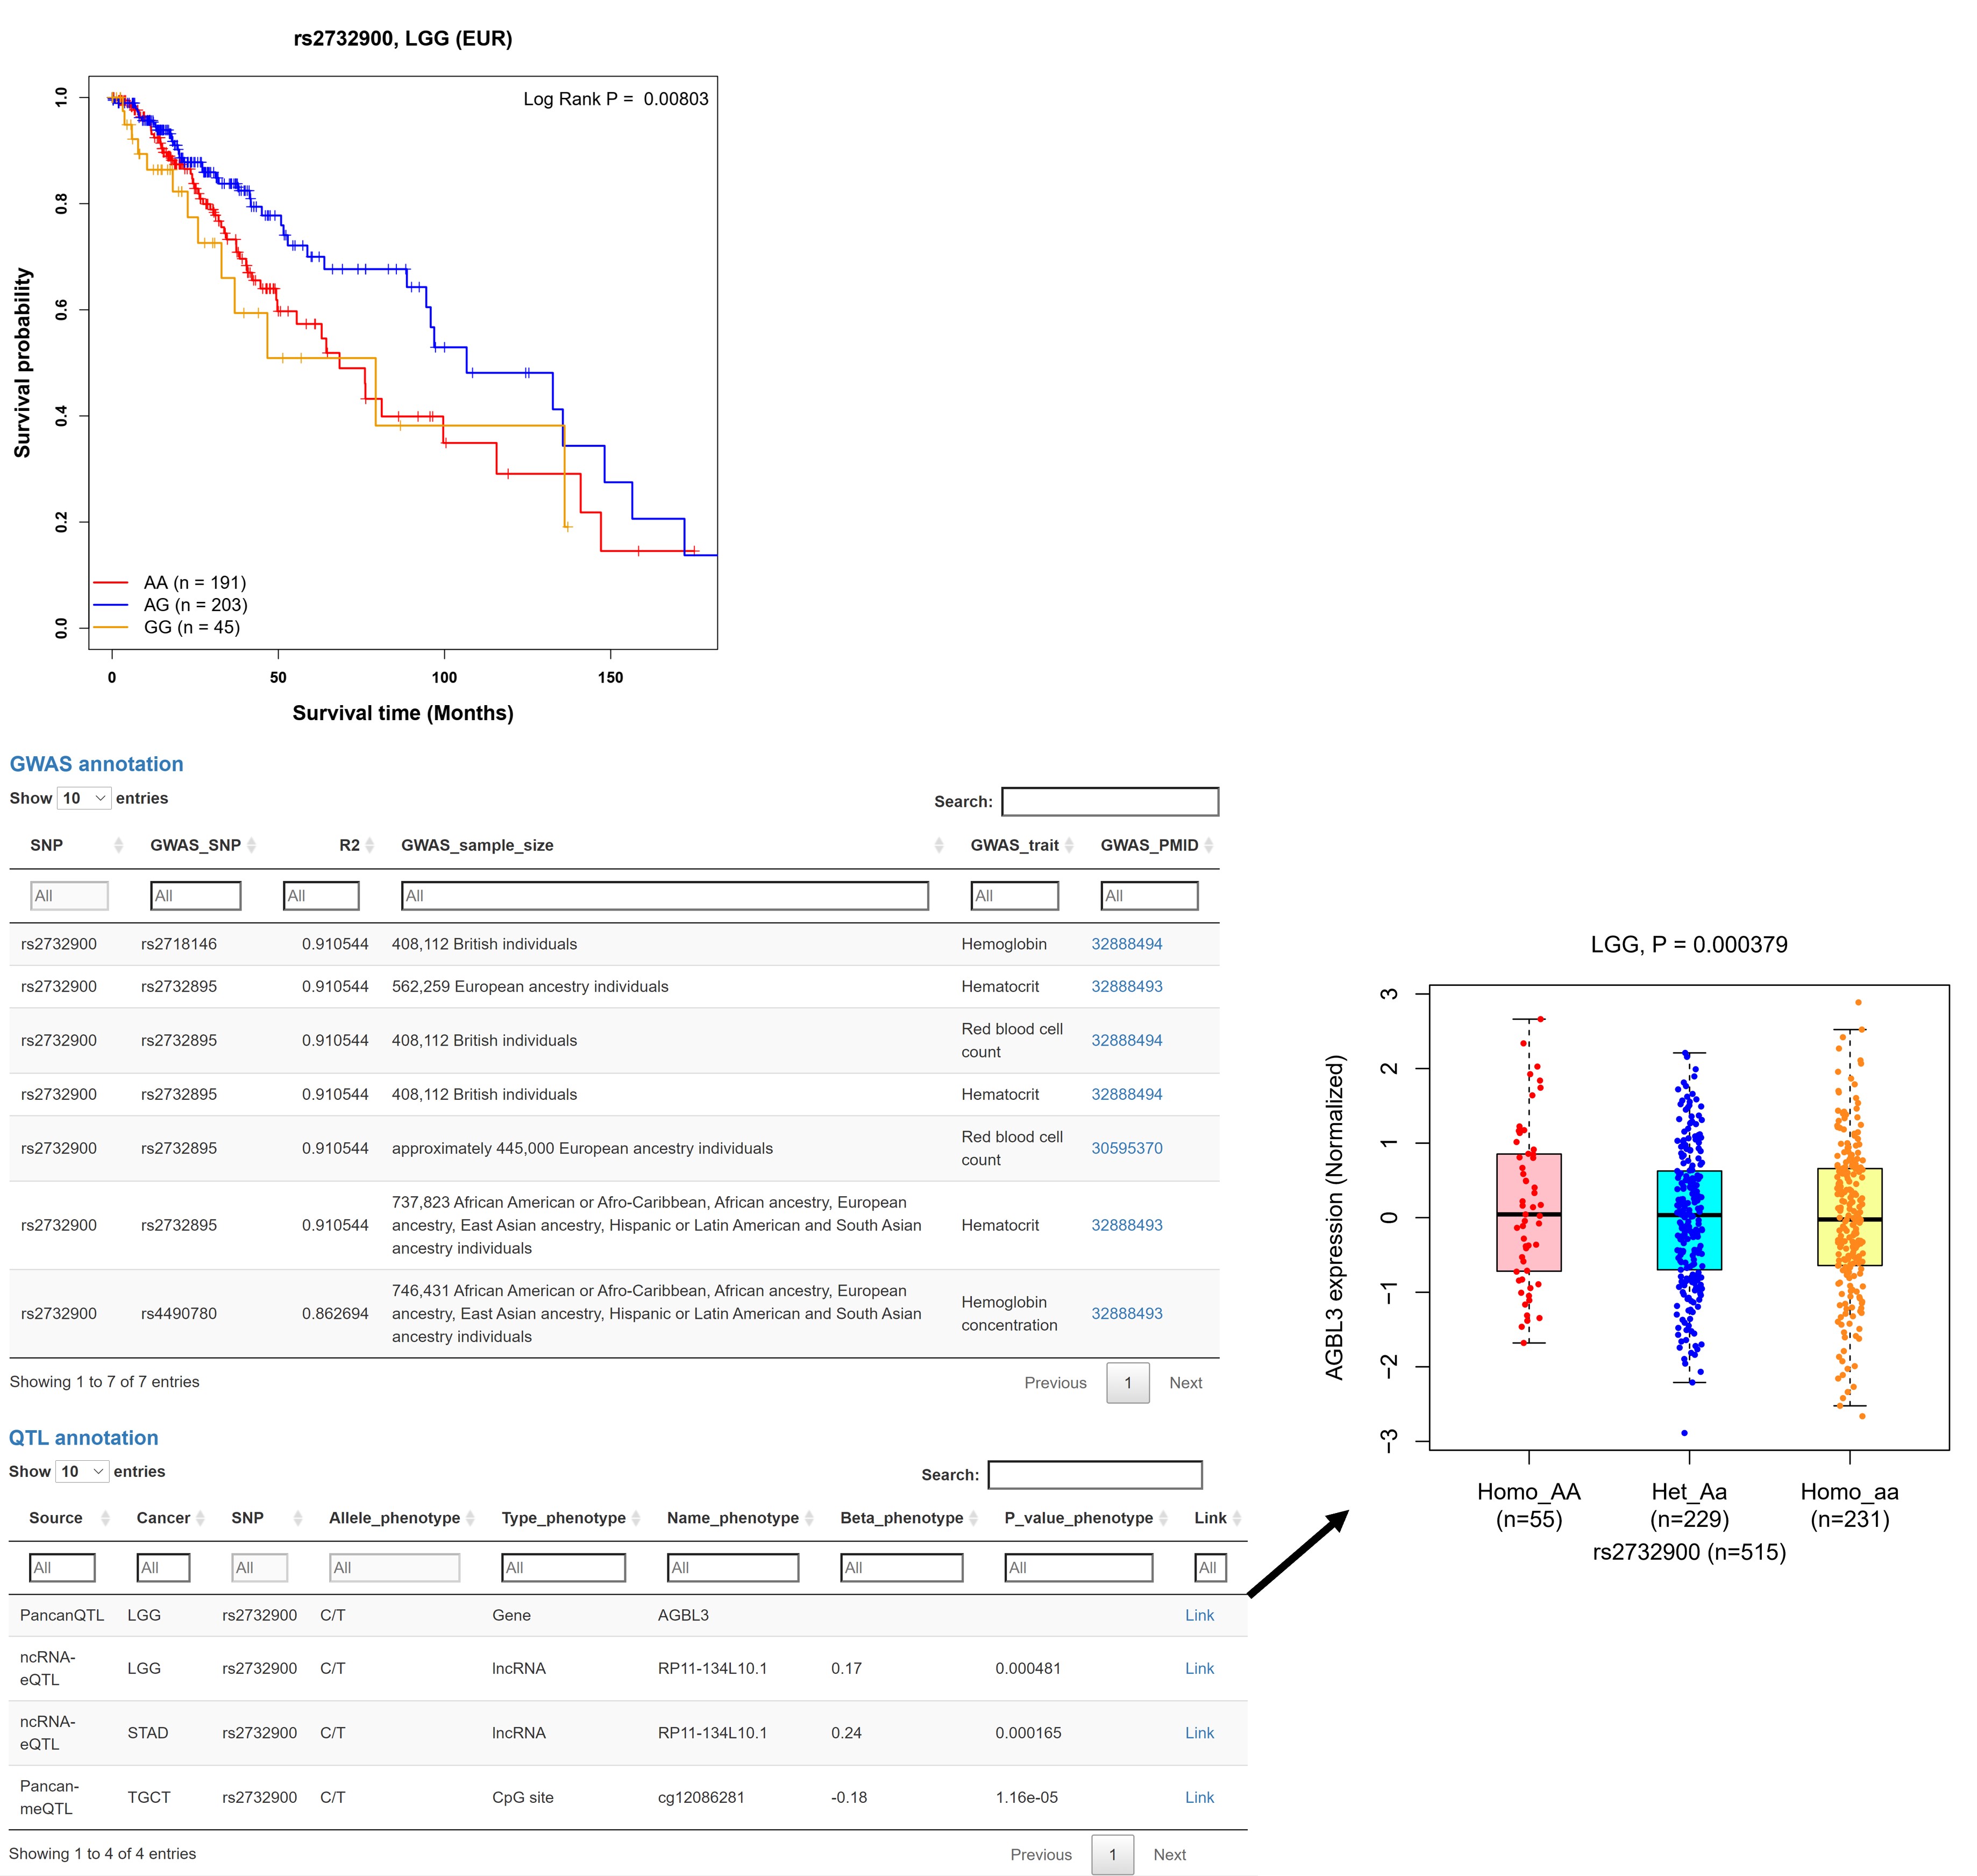
e. Survival and functional annotation
User guidelines: When users select one pair and click the 'Plot & clinical and functional annotation' button, the results of survival analysis and functional annotation are also provided.
Example: For a SNP rs2732900 associated with decreased TP53 somatic mutation rate (OR = 0.46, P = 3.38E-06) in LGG patients of EUR ancestry, survival analysis indicated that individuals with rs2732900 genotype AG also had an improved overall survival (OS) compared to those with genotype AA (log-rank P = 0.008). In addition, functional annotation results showed that rs2732900 was reported by previous GWASs related to hemoglobin, hematocrit, and red blood cell count, as well as was associated with some QTL phenotypes (e.g., AGBL3 expression in LGG tumors).